Pages

Showing posts with label EA. Show all posts

Saturday, September 13, 2025

B2B Marketing Analytics: Account Engagement Email Datasets

To continue from the previous blog, if you get an error when creating the B2B Marketing Analytics app, once the app is created successfully, you will see a new app for the B2B Marketing Analytics app; the app name is based on what you entered when creating the app. 

Within the app, you will get many datasets available, starting with "Account Engagement". The datasets are updated daily by Salesforce from MCAE to CRM Analytics. You can monitor it from Jobs Monitor, look for jobs that start with "pd".


You will see the dataset in the B2B Marketing Analytics app, including when the data is refreshed.  

** To get the Prospect and Activity dataset, you need to enable "Get Prospect and Activity Data" in the B2B Marketing Analytics setup menu, which is under Optional Features for B2B Marketing Analytics, then select "Include Prospect and Activity dataset?" when creating the app.


The app comes with multiple dashboards, such as "Engagement," which shows MCAE data, such as:

  • List Email Engagement
  • Email Template Engagement
  • Forms Engagement
  • Landing Page Engagement
These include different metrics for each type of engagement.

In this blog, I want to discuss two of the datasets: the Account Engagement Emails dataset and the Account Engagement Email templates dataset.


Account Engagement Emails dataset 

As per this article, B2B Marketing Analytics Datasets, the dataset API Name is pdEmail. Each row represents 1 day of statistics for an individual list email. You can see the field description in the article above. Let's see some samples:

For Email ID = 2012421957, emails are sent on 2025-09-10, so you see the same Send On Date applied to rows 1 and 2. Some recipients open and click on the same day, and a few open on 2025-09-11. The same applies for Email ID = 2011677609; emails are sent on 2025-09-09 for rows 3, 4, and 5; some people open and click on the same day and the following days. So, this is aggregate data per day per email.

Stats ID is the unique key in the dataset.

Available metrics for this dataset:

  • Click To Open Ratio
  • Delivery Rate
  • Opt Out Rate
  • Spam Complaint Rate
  • Total Bounced
  • Total CTR
  • Total Clicks
  • Total Delivered
  • Total HTML Opens
  • Total Hard Bounced
  • Total Opt Outs
  • Total Queued
  • Total Sent
  • Total Soft Bounced
  • Total Spam Complaint
  • Unique CTR
  • Unique Clicks
  • Unique HTML Open Rate
  • Unique HTML Opens


Account Engagement Email Templates dataset 

From the same article above, the dataset API Name is pdEmailTemplate. Each row represents 1 day of statistics for an individual email template. Email metrics are based on the emails built on selected email templates. 

The email sent here are not from the list email, but automated email, such as the Autoresponder email in Completion Action or Engagement program emails. The email here are not sent at the same time, but only when the user submits a form or receives an auto email from the engagement program.

The Send on Date field is not present on this dataset. This is because templates are reusable email designs that are not tied to specific send events.


We can see the same pattern here: each row represents an Email ID for a day, the total emails sent in a day, email opens, and clicks. 

Similar to the Email dataset, Stats ID is the unique key in the dataset, and almost all metrics are also available in this dataset:
  • Delivery Rate
  • Opt Out Rate
  • Spam Complaint Rate
  • Total CTR
  • Total Clicks
  • Total Delivered
  • Total HTML Opens
  • Total Hard Bounced
  • Total Opt Outs
  • Total Queued
  • Total Sent
  • Total Soft Bounced
  • Total Spam Complaint
  • Unique CTR
  • Unique Clicks
  • Unique HTML Opens

Note: There is an issue with the "Unique HTML Opens" field in this dataset. Here is the KI and idea.


Reference:

Friday, September 12, 2025

CRM Analytics: Enhancing Dashboard Filter with Custom Range Value

Requirement: Create a filter in the dashboard that bucket sums the Amount of customers into categories, such as low (< $500), medium ($500 - $1000), and high (> $1000). The result should be updated dynamically as filtered when other widgets are selected. The range of the Sum of Amount should be fixed, not depend on the Sum of Amount values in the data.

Solution: As each user can select different filters, such as Region, Product, etc., we can't stamp the sum of Amount in the dataflow/recipe. Binding is here to help.

Step-by-step:

1. Create Custom Query


  • We need "All" as the 1st value. This is when the dashboard loads; it will load all data. Remember to select the list widget selection type as "Single selection (required)".
  • The max value for All and the high (last) row can be set as high as possible.


2. Add Table Widget

  • Change the table to Compare Table
  • Group By: Customer or Account name
  • Change Column to Sum of Amount
  • Add a Filter to the Sum of Amount column, use the medium range, which is between 500 and 1000


3. Add Binding to the Filter Range
  • Select the table widget added.
  • Click Advanced Editor >> Query tab
  • Look for "aggregateFilters" with values 500 and 1000
  • Change 500, 1000 to the following
"{{coalesce(cell(static1_1.selection, 0, \"low\"), cell(static1_1.result, 0, \"low\")).asObject()}}",
"{{coalesce(cell(static1_1.selection, 0, \"high\"), cell(static1_1.result, 0, \"high\")).asObject()}}"
  • Save the query and done :) 


Result

See the table widget

no filter

6 months ago to today

6 months ago to today, and the Sum of Amount between $500 - $1000

Product X3 and X4, and the Sum of Amount between $500 - $1000


Friday, August 15, 2025

CRM Analytics: Join or Augment Master to Child

When you augment the master table with a child table and there are multiple rows for the same master value, which row will the dataflow and recipe select?

Sample Data:


Master

Child

Dataflow

With "Look Up Multiple Values"

With "Look Up Single Values"

Summary:
  • Look Up Multiple Values: sum value of all numeric (measure) fields, while dimension (text) fields will retrieve all values, although only 1 value is shown when you browse the data in a lens. Check out this blog
  • Look Up Single Values: the first matching record for both numeric and text fields.

Recipe

With "Look Up Multiple Values"


Without "Look Up Multiple Values"

Summary:
  • With Look Up Multiple Values: sum value of all for numeric (measure) fields, while dimension (text) fields will retrieve all values, "all values" will be shown in the recipe, but in Lens, it will show 1 value only. 
  • Without Look Up Single Values: as per this article, Lookup - the lookup returns only the first matching record. However, in my test results, the system will get the row with the lowest value of the numeric field in sort order. If no numeric field, sort the text field alphabetically in ascending order and get the first row.


Reference:


Thursday, August 7, 2025

CRM Analytics: Sort Date field

I recently encountered working with a CSV file containing a date field in dd-MM-yyyy format. CRMA supports this format when manually loading the CSV file. Additionally, you can vote for this idea for more format support.


However, once the field is uploaded to CRMA, even if it is selected as a Date type, it is stored as dimensions, although it automatically generates multiple derived fields (like day, month, year, quarter, day_epoch, etc.).

This causes an issue when you add the field in a table widget and sort it. Because the generated date fields are dimensions, sorting is performed alphanumerically rather than in date order.


Here are a few workarounds:

1. Add the day_epoch field and sort with that field, although it is not a good user experience


2.  Load the CSV file in yyyy-MM-dd format


The system supports using the yyy-MM-dd format when uploading the CSV file


3. Use toDate() function in the dashboard, but this approach will stop your ability to edit the dashboard with clicks

q = load "ddmmyyyy";
q = foreach q generate q.'Id' as 'Id', q.'Amount' as 'Amount', q.'Date' as 'Date',toDate(Date_Year+"/"+Date_Month+"/"+Date_Day,"yyyy/MM/dd") as 'Date_Formatted';
q = order q by 'Date_Formatted' asc;
q = limit q 100;


4. Same as (3) by using toDate() function in a dataflow or recipe.

Check out the samples here and here.


Reference:


Monday, July 28, 2025

B2B Marketing Analytics: sfdc_internal__B2BMA

B2B Marketing Analytics, a CRM Analytics app within Salesforce, is designed to analyze marketing and sales data. It leverages datasets from Account Engagement (formerly Pardot) and Salesforce to provide insights into campaign performance, prospect behavior, and overall marketing effectiveness. 

You can create the B2B Marketing Analytics app from Analytics Studio, select B2B Marketing Analytics, and follow the wizard.


You need to enter your Pardot Account ID, then select optional features, such as Account-Based Marketing, Multi-Touch Attribution, Prospect and Activity dataset, etc. If you stopped with the following error:

Unable to create app based on template: [sfdc_internal__B2BMA].

* Your org does not currently meet minimum data requirements to proceed. Please fix the following issues before creating a 'B2B Marketing Analytics' Application:

In the 'sfdcDigest_Contact_CWA' node, the 'pi__grade__c' field doesn't exist, is deprecated, or isn't accessible to the Integration User. In the 'sfdcDigest_Contact_CWA' node, the 'pi__score__c' field doesn't exist, is deprecated, or isn't accessible to the Integration User.

You need to adjust the fields in both Lead and Contact, the Account Engagement Score (pi__score__c) and the Account Engagement Grade (pi__grade__c) fields, to make them visible (read-only is sufficient) to the Analytics Cloud Integration User profile. 

From the object manager, open each field and update the field-level security settings to grant visibility to the Analytics Cloud Integration User profile. 

Re-create the B2B Marketing Analytics app from Analytics Studio, and you should be able to pass the error.

Once the app is created, it can also be seen in the "Auto-Installed Apps" in the setup menu.


Monday, May 12, 2025

CRM Analytics: Unsupported Salesforce Data

CRM Analytics (CRMA) is an analytics tool by Salesforce and is hosted in Salesforce's core platform; however, not all of Salesforce's objects and fields are supported by CRM Analytics data sync, including external objects, so you can't build a CRMA dashboard that uses those fields or objects. Check out the following article.

A supported object is one for which you can grant field-level access in Setup. If you're unable to assign field access to a Profile in Setup, that object is considered unsupported in CRMA, e.g. LoginHistory object.

The following statement from the above help article explains this: "To extract fields, the object must be visible to the Integration User. If you can’t manage a field’s visibility in Setup, you can’t grant the Integration User access to it."


Reference:


Monday, April 14, 2025

CRM Analytics: Why I don't see Action

CRM Analytics offers users immediate action on a particular data in the dashboard. The "action" here refers to Salesforce action, where you can create and edit data directly from a CRM Analytics dashboard. 


You can configure this from the dataset level by editing the dataset and then clicking the Configure Actions button or from the dashboard/lens, then click Configure Actions from the drop-down menu. 


However, you may experience the action is not visible to you or your user; here 2 things that you can check:

1. CRM Analytics displays only the actions that are added to both the Quick Actions in the Salesforce Classic Publisher and the Salesforce Mobile and Lightning Experience Actions sections of the layout. This applies to the page layout assignments as per the user profile, too.


2. The user doesn't have permission to perform the action on a specific object, such as not having Edit permission on the record or object to update the record action.  


Reference:


Tuesday, March 11, 2025

CRM Analytics: Dynamic table with Input Widget

Use case: give users the ability to show top N open opportunities based on Amount in a dashboard.

Step:

  1. Add a table widget with the columns, set a query limit (example 10), and add filters as needed; for my use case, the filter isClosed = false and sorted by Amount.
  2. Add an input widget and set the parameters in Input Values and Input Style.
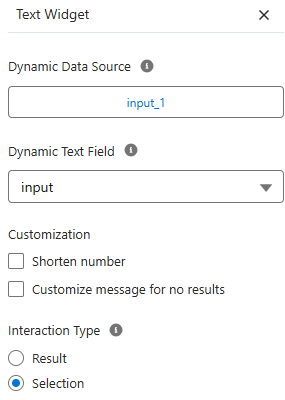
  3. Add a text widget to show the top X rows for the column.

Here is the result:


What needs to be configured?

  • There is no need to change the input widget except the parameters mentioned above. 
  • For the table widget to show top X records, we need to change the limit from 10 (example) with binding [ "{{cell(input_1.selection, 0, \"input\").asObject()}}" ]; input_1 is the Query ID of the input widget.
  • For the text widget, click the "Add Query Data" button and select the Dynamic Data Source, Dynamic Text Field, and Interaction Type as below; you can manually add "Top " text after configuring the query data.


Reference:


Monday, March 10, 2025

CRM Analytics: Duration between Date or Date/Time Fields

In the SAQL samples blog, we briefly share samples of formulas for calculating duration between 2 date or date/time fields using daysBetween(start dateend date) and date_diff(datepartstart dateend date).

Let's see more details in this blog here and use the sample data below with the user timezone as GMT.


SAQL to calculate days between date/time with date field:

  • daysBetween(toDate(DateTime1__c_sec_epoch), toDate(Date1__c_sec_epoch))
  • date_diff("day", toDate(DateTime1__c_sec_epoch), toDate(Date1__c_sec_epoch))


Notes

  • If date1 is after date2, the number of days returned is a negative number.
Analysis:
  • date_diff() will simply compare the date value only, ignoring the time value. If you see rows #9, 10, and 11, the time value is removed, so the duration would be 2 days. The same behavior applies to all other rows.
  • daysbetween() is a bit complicated; the formula will consider the time value in the calculation, but the result is truncated without decimal points; for example, row #11 -- start date = 2025-02-27T11:00:00.000Z, end date = 2025-03-01 is treated as 2025-03-01T00:00:00.000Z; exact time difference = 1 day 13 hours, the result is truncated as 1. take another example from row #2, where start date = 2025-03-02T23:45:00.000Z, exact time difference =  -1 day, -23 hours, -45 minutes, the result is truncated as -1.

Now, let us change the user timezone to Singapore, which is GMT+8.


The result in CRM Analytics is the same as before changing the user timezone. The Date/Time field will be converted into GMT timezone (for Custom Time Zone Support is not enabled).


If you need to calculate the duration in hours or minutes, you can only use date_diff(). Let's see some samples below. This is similar to the "day" datepart, which ignores the whole time; if we use "hour," it ignores minutes onwards.


Analysis: Rows #10 and 11 have the same result because the minute in DateTime1 is ignored; the same is true for rows #1 and 2, even though they are just 15 minutes different in the exact time difference, but they will be shown as 1 hour.


Reference:

Friday, February 28, 2025

CRM Analytics: Long Text Area field only show 255 chars

The Long Text Area field or Rich Text Area field allows users to enter up to 131,072 characters on separate lines, which by default is 32,768 when creating the field. However, the table widget in CRM Analytics only shows 255 characters. What is the cause?

By default, Precision is blank in the sync setup; you can navigate from Data Manager >>  Connections >> SFDC_LOCAL, click the object name, click the pencil icon next to the field name, enter the length of the characters as you need in the Precision box.


Friday, February 21, 2025

CRM Analytics: Calculate aging excluding weekends in Dataflow

We shared the Salesforce formula field to calculate aging without the weekend here. But can we replicate it in CRM Analytics? 

Here is the formula using dataflow in compute expression:

Full_Weeks (in Numeric)
floor(date_diff("day", toDate(CreatedDate_sec_epoch), toDate(CloseDate_sec_epoch))/7) * 5

Remaining_Days (in Numeric)
date_diff("day", toDate(CreatedDate_sec_epoch), toDate(CloseDate_sec_epoch)) % 7

Start_Day (in Numeric)
day_in_week(toDate(CreatedDate_sec_epoch))

Weekend_Adjustment (in Numeric)
case when (Start_Day + Remaining_Days) > 7 then 2 
     when (Start_Day + Remaining_Days) == 7 then 1 else 0 end

Business_Days_Aging
Full_Weeks + Remaining_Days - Weekend_Adjustment


Notes:
  • The floor(numeric) function rounds a numeric value down to the nearest integer. For example, floor(125.625) will return 125.
  • For more information and samples on date_diff() function, check out this blog Duration between Date or Date/Time Fields
  • The day_in_week(date) function returns the day of the week as numeric, where Sunday = 1, Monday = 2, etc.

Sample:


Monday, November 11, 2024

CRM Analytics: Recipe formula syntax in Transform node

For those who have used Dataflow in the past and migrated to Recipe recently, some of the syntax and functions are different from SAQL in Dataflow.

1. string
use ' instead of "
in SAQL, case when 'Data.Name' is null then "No" else "Yes" end
in the recipe, case when "Data.Name" is null then 'No' else 'Yes' end


2. operand in comparison
in the recipe, equal, use = instead of ==
unequal, use !=


3. operand logic
in the recipe, use AND or OR


4.  instr() to replace index_of() 
Syntax: instr(field, searchString, [position, [occurrence]])
instr('123!456!78!', !) -- the result is 4
instr('123!456!8!', !, [4])  -- the result is 7
instr('123!456!8!', !, [4, [2]])   -- the result is 9
case when instr(Email, '@ap') > 0 then 'APAC' when instr(Email, '@eu') > 0 then 'EMEA' else 'AMER' end


5. to_timestamp() to replace toDate()
in SAQL, case when 'Region' == "APAC" then toDate("2024-01-06 21:00:00") 
else toDate("2024-01-07 11:00:00") end

in the recipe, case when "Region" = 'APAC' then to_timestamp('2024-01-06 21:00:00') else to_timestamp('2024-01-07 11:00:00') end

The output type from to_timestamp is Date Time.


6. Formula in Compute Relative
Make sure the "Multiple row formula" is selected
in SAQL, case when previous(CaseId) is null  then "Yes" else "No" end
in the recipe, case when lag(CaseId) IS NULL then 'Yes' else 'No' end


7. format_number() to replace number_to_string()
in SAQL, case when 'OwnerHistory.OwnerChangeCount' is null then "00" else number_to_string('OwnerHistory.OwnerChangeCount',"00") end

in the recipe, case when "OwnerHistory.OwnerChangeCount" IS NULL then '00' else format_number("OwnerHistory.OwnerChangeCount", '00') end


8. Date/time comparison
in SAQL, case when ('CreatedDate_sec_epoch' >= StartDateTime_sec_epoch) && ('CreatedDate_sec_epoch' <= EndDateTime_sec_epoch) then "Yes" else "No" end

in the recipe, case when (to_unix_timestamp(CreatedDate) >= to_unix_timestamp(StartDateTime)) AND (to_unix_timestamp(CreatedDate) <= to_unix_timestamp(EndDateTime)) then 'Yes' else 'No' end


9. substr()
Formula substr() has no change in recipe
case when substr(OwnerId, 1, 3) = '00G' then 'Yes' else 'No' end


10. IN() function
in SAQL, Type in ["Transfer", "TransferredToSbrSkill"]
in the recipe, Type IN ('Transfer', 'TransferredToSbrSkill')


Reference:

Friday, May 17, 2024

CRM Analytics: Recipe and Dataflow case sensitive

Key in join node in CRM Analytics is case-sensitive, sample:


The same applies to the augment node in the dataflow; the key is case-sensitive too, sample:


Tuesday, April 23, 2024

CRM Analytics: Recipe syntax

Every computer language has its own syntax, the same with query language or formula. Here are the samples of SAQL that are used in Dataflow.

 Since CRM Analytics is moving with Recipe, here are samples of the formula syntax in the Recipe:

String - use '  ', e.g., 'Singapore'

Field name - use "  ", e.g., "Account.Id", optional if the field name does not contain dot(s)

Field with blank value - "Opportunity.Id" IS NULL

CASE, e.g., case when Have_Activity = 'Yes' or Have_Opportunity = 'Yes' then 'No' else 'Yes' end

IN with (), e.g.,
case when Type in ('Customer', 'Other') then 'A'
        when Type in ('Customer - Direct', 'Customer - Channel') then 'B'
        else 'C' 
end

Logical Function
use or, and, e.g., case when Have_Activity = 'Yes' or Have_Opportunity = 'Yes' then 'No' else 'Yes' end

Compare Operator
use != (not <>) as compare operator, also use = (not ==), e.g., Have_Activity != 'Yes'

Current and Previous Quarter
case 
    when quarter(now()) = 2 and (year(now()) = year(LastActivityDate)) then 'Yes' 
    when quarter(now()) = 3 and (year(now()) = year(LastActivityDate)) and (quarter(LastActivityDate) in (2,3)) then 'Yes' 
    when quarter(now()) = 4 and (year(now()) = year(LastActivityDate)) and (quarter(LastActivityDate) in (3,4)) then 'Yes' 
    when quarter(now()) = 1 and ((year(now()) = year(LastActivityDate)) or (quarter(LastActivityDate) = 4 and year(LastActivityDate) = year(now()) -1)) then 'Yes'
    else 'No'
end


Do you have a great formula to share? Feel free to add in the comment.


Friday, April 19, 2024

CRM Analytics: Adding Salesforce Action in CRM Analytics

Here is the step:

1. Create Salesforce Action --  navigate to Salesforce's object manager, look for the object, click on Buttons, Links, and Actions menu, then click New Action.

2. Add the newly created Action to a Salesforce page layout (this is a must).

3. Configure the Action from the CRM Analytics dataset. 


Once configured, if you have a table widget in the dashboard, you can also set up one-click actions, so by clicking the value, the action selected will be performed, e.g., click the value in Account Name to call the action to edit Industry.


Reference:


Monday, January 15, 2024

CRM Analytics: Sync Widget to other Layouts

In the previous blog, we shared that you can manually add widgets that have been added in other layouts. Since then, CRM Analytics has a new feature to enable sync between layouts, which means that when you add a new widget, it will be added to other existing layouts automatically. The same when you delete widgets from a layout; it will be deleted in other layouts too.

Click Manage Layouts from the layout dropdown and make sure Sync is enabled.


Widgets synced to other layouts will be added randomly in other layouts.


Reference:


Thursday, November 30, 2023

CRM Analytics: URL tips

In scenarios when we can't open a dashboard or dataset via "click", here are some shortcuts.

Open Dashboard JSON Editor

Add "/json" at the end of the Dashboard Id, e.g., https://domain.lightning.force.com/analytics/dashboard/0FK34000000KzniGAC/json


Explore Dataset 

https://domain.lightning.force.com/analytics/lens/new1/dataset/0FbHr000000dSdAKAU
If you are wondering what "new1" is, you can change it to new2 or new3, etc.


Edit Dataset

https://domain.lightning.force.com/analytics/dataset/0FbHr000000dSdAKAU
or 
https://domain.lightning.force.com/0FbHr000000dSdAKAU  This will be translated as https://domain.lightning.force.com/lightning/r/EdgeMart/0FbHr000000dSdAKAU/view


Reference

Monday, October 23, 2023

CRM Analytics: Salesforce Output Connection

For those who use CRM Analytics, we know that we can use dataflow/recipe to prepare datasets, which means transforming data for use in dashboards. Additionally, using a recipe, you can use the data prepared (with transformed data) to store in Salesforce or another Salesforce org. Imagine that CRM Analytic experts now become a specialist without the need to write scripts for Apex Scheduler.

Push your prepared dataset data into any Salesforce org from CRM Analytics Salesforce Output connector and Data Prep. With your prepared data back in Salesforce, you can integrate external data, apply the suite of Salesforce automation tools to act on the data, and allow non-CRM Analytics users access to the data through reports and dashboards.

Here are the steps:

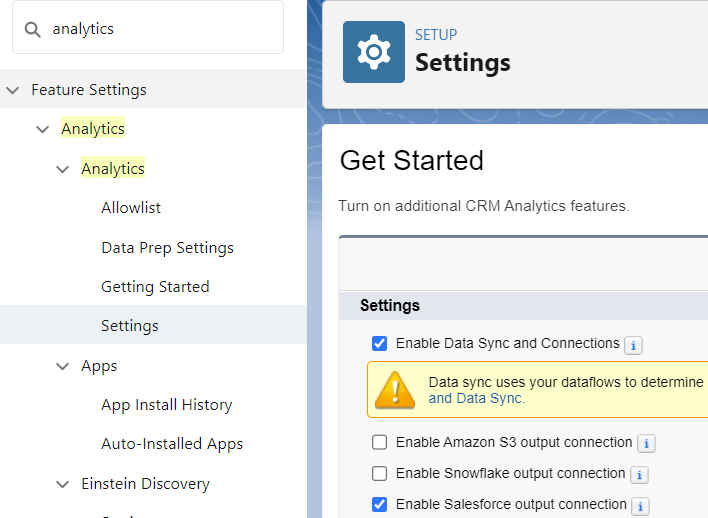
1. Enable "Enable Salesforce output connection" in the Analytics Setting in the Salesforce setup menu.


2. From Analytics Studio >> Data Manager, create an Output Connection; remember to add the security token after the password and change the Service URL if you plan to test in a sandbox


3. In the recipe Output node, select "Write To" with "Output Connection"; the operation could be Insert, Update, or Upsert. For the update operation, select a field from the destination object for the External ID to act as the unique record identifier, such as an Id from the source object, but it can't be a look field. The system will match using this field to determine if the operation to insert to update.


Scenario: sync a custom object from Account with a lookup field from the custom object to Account. 

As mentioned above, you can't use a lookup field as an External Id, so we need to create a text field to store the Account Id in the target object for matching. 

All columns from the source must be mapped one-to-one to the output object, which also means we can't map the field from the source node twice, so we need to clone the source field in a transform node.

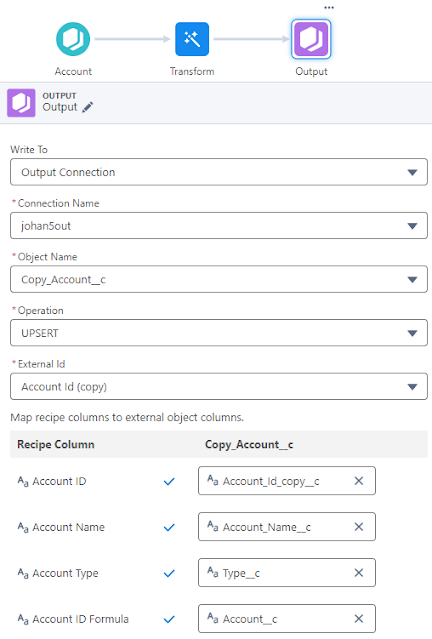
Here is the detail of the Output node in a simple recipe:


External Id is set to the "Account Id (copy)" field, which is a text field in the target object to hold the Id of the Account record.

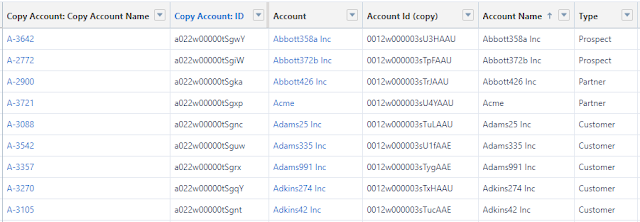
These are the fields of the target object :


Result after recipe run:


Reference:


Page-level ad