Pages

Monday, January 30, 2023

Salesforce: Field History Tracking for Activities

Activity in Salesforce is represented by Task and Event objects, they are special objects with a few limitations compared to other standard and custom objects, one of them being field tracking.

Before the Spring '23 release, you can't track field changes in the Activity, with community members creating and voting this in IdeaExchange that earned 33000+ votes.

The spring '23 release allows us to track activities fields history, with some limitations, but it is definitely a good starting. 

Navigate to the Task or Event object and click the "Set History Tracking" button and select up to 6 fields.

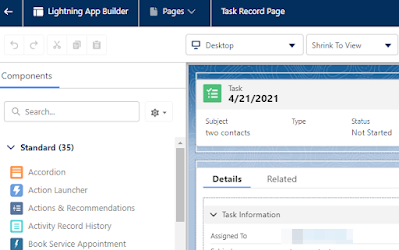
You can add the Activity Record History component from Lightning App Builder.


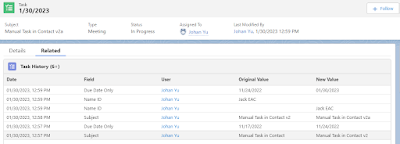
Here is the sample result in a Task:


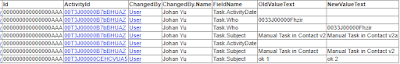
Unfortunately, I don't see this yet in reporting, hope this will come in coming releases, or let me know if you see this. But you can query with API to object ActivityFieldHistory.

sample query: SELECT Id, ActivityId, ChangedBy.Name, FieldName, OldValueText, NewValueText  FROM ActivityFieldHistory 

I have no idea why the Ids are 000000000000000AAA, hope will see some explanation in the future.


For more information, looks for Event and Task History Considerations in this article Field History Tracking (as per Spring 23 release):

  • It can take up to a few minutes for changes to appear in history.
  • You can track up to six fields on events or tasks.
  • After an activity is deleted, the history for the activities can be visible via API queries for up to a few days. The history remains available because it’s deleted asynchronously from the activity.
  • Not all changes to recurring and child events are tracked.
  • You can’t delete specific field history records.
  • Bulk processes such as Bulk API transactions or event syncing can be delayed when field history tracking is enabled. If processes are delayed, consider turning off activity field history tracking.
  • The parent record of an activity is locked when the activity history updates. For example, if an activity is linked to thousands of accounts, each account is locked while the history updates. As a best practice, avoid data skew. If processes fail because of parent-child row locking, consider turning off activity field history tracking.
  • Field value changes caused by process builder, Apex triggers, or flows are tracked in an activity’s history. Users see the change only if their field-level security settings permit them to. In other objects, field changes from processes, triggers, and flows are tracked only if the current user has permission to edit the modified fields.
  • If a previously encrypted field used for tracking is unencrypted, the values tracked while the field was encrypted don’t appear. After the field is unencrypted, the values are tracked in history.
  • Activity history is available in APIs only for admins with permission to modify all data.
  • For activities, field history is shown in a Lightning component that looks like a related list. Instead of managing the history on the page layout, you place the Activity Record History component on Lightning pages for event and task records. You can add the Activity Record History component to custom event and task pages or remove it from the default pages. The history list stays empty until you turn on field history tracking in the Object Manager.
  • The history list isn’t available in Salesforce Classic or in the mobile app.


Reference:


Wednesday, January 4, 2023

Salesforce: Object tab visibility in App

A tab of an object is very useful and increases user daily productivity with fewer clicks, the tab will be visible in an app based on multiple settings, let's dive into it.

First, for a user to able to see the tab, the user must have access to the object via Profile or Permission Set. 

Default tab -- this mean, the tab will be always visible to the user, and users can't remove it from the Lightning app, the user will not see the cross icon when clicking the pencil icon from the navigation bar.

Users will not able to remove the Home tabs until the Chatter tabs


The criteria to make a tab become a default tab:

  1. The user must have permission to access the object via Profile or Permission Set, and
  2. The tab is added to the Navigation Items for the app in the Lightning App Builder, and
  3. The tab is set to Default On in the Profile, or "Visible" is checked from Permission Set

If (2) or (3) is changed, the tab will be removed if a user has not customized the navigation items, but if the user has customized (rearrange) the navigation items, the tab will stay, but the user will be able to remove the tab by clicking the pencil icon from the navigation bar, see this blog for detail.


Not default tab
-- the example from the above screenshot is "Glass", where the tab is removable. To make this happen, here are the requirements:

  1. The user must have permission to access the object via Profile or Permission Set
  2. The tab is set to Default Off in the Profile, or only "Available" is checked in the Permission Set, no matter whether it is added or not in the lightning app Navigation Items. 

The user should be able to search the tab from the 9-dots icon.


Reference:


Monday, January 2, 2023

SimplySfdc in 2022

 
Happy new year 2023! This also meant that SimplySfdc has shared tips and knowledge related to Salesforce for 11 years, with more than 650+ blogs, what an incredible journey!

As per tradition, this blog will share some statistics of SimplySfdc in 2022 -- here is the statistic for 2021.


In 2022, fewer blog posts were written, but total pageviews and sessions were almost similar to 2021.

Page 2022 2021 2020 change*
Total New Page 37 50 29 -26.00%
Total Pageviews 1,038,945 971,076 305,957 6.99%
Total Sessions 485,794 491,048 271,214 -1.07%
Pages / Sessions 2.14 1.98 1.13 8.08%
* compare 2022 to 2021


In 2022, direct access to the blog increased by more than 57%, while traffic from searches was down by 4% compared to the previous year. Both referral and social which were pretty low in 2021 are getting lower in 2022.

Channel Source 2022 2021 2020
1. Organic Search 85.04% 88.58% 82.86%
2. Direct 12.29% 7.78% 13.73%
3. Referral  2.27% 2.88% 2.69%
4. Social 0.39% 0.75% 0.71%


Again, traffic from Google getting lower, and from Bing is increasing over the years, although, it has not created a lot of impacts yet.

Top Search Engine 2022 2021 2020
1. Google 94.35% 95.94% 96.85%
2. Bing 4.84% 3.19% 2.12%
3. Yahoo 0.34% 0.27% 0.44%
4. Other 0.47% 0.59% 0.58%
 

Except for Germany, which also jump from #7 in 2021 and 2022 to #5 in 2022, all top 6 countries contribute lower traffic. The gap between the United States and India getting closer with only a 6+% difference. One note from this insight is, more countries are accessing SimplySfdc.com because Salesforce.com is used by more countries.

Top Visitor Country 2022 2021 2020
1. United States 32.93% 35.06% 37.27%
2. India 26.57% 27.40% 25.20%
3. United Kingdom 4.63% 4.88% 4.78%
4. Canada 3.30% 3.34% 3.09%
5. Germany 2.76% 2.08% 2.18%
6. Australia 2.56% 3.05% 3.03%
* Germany was #7 in 2021 and 2020
* Australia was #5 in 2021 and 2020
* France was in #6 in 2021 and #8 in 2020


From the cities' perspective, the top 5 cities are still the same as in 2021. Most familiar cities still appear in the top 6 cities. New York resurfaces back to #6 from #7 in 2021. All top 6 cities (except Bengaluru) contribute a lower percentage compared to 2021. The top 6 cities represent 13.32% of the total visitors, which is a bit lower than in 2021 where the top 6 cities contribute 13.54%. 

Top Visitor Country 2022 2021 2020
1. Hyderabad 3.66% 3.67% 3.86%
2. Bengaluru 3.05% 2.88% 3.80%
3. Pune 2.07% 2.13% 2.38%
4. London 1.59% 1.66% 1.86%
5. Mumbai 1.48% 1.61% 1.36%
6. New York 1.47% 1.49% 1.45%
* Mumbai was #7 in 2020
* New York was #7 in 2021 and #6 in 2020
* Chennai was in #7 in 2022 and #6 in 2021

This statistic includes access from desktop and mobile. Total top 5 web browsers contribute almost  99% of the visitors. Chrome again proves as the default web browser for everyone, and although it is on a downtrend, this may mean something for Chrome for its market domination. Edge shared is kept higher, while the rest are lower compared to 2021.

Top Visitor Web Browser 2022 2021 2020
1. Chrome 86.05% 86.94% 88.78%
2. Edge 6.94% 5.20% 2.64%
3. Safari 3.49% 4.02% 3.13%
4. Firefox 2.15% 2.65% 3.10%
5. Opera 0.29% 0.37% 0.30%


In terms of the operating system, there is no change in the top 5 operating systems. Windows users decreased by more than 3%, and Android shows a bigger jump to more than 8%. Traffic from mobile and tablet users increase quite significantly to 12.60%.

Top Visitor Operating System 2022 2021 2020
1. Windows 66.24% 70.01% 70.59%
2. Macintosh 19.81% 20.31% 19.57%
3. Android 8.39% 4.84% 5.16%
4. iOS 3.21% 3.41% 2.80%
5. Linux 1.57% 0.92% 1.34%


As mentioned in the previous year's blog, a screen resolution of 1536x864 probably is 1920x1080 resolution with the display set to 125% zoom, and 1280x720 is 150% zoom of 1920x1080. So in total, 1920x1080 contributes to more than 51%. 
The resolution of 1920x1080 is the standard for most users, and more users move to WQHD (2560x1440) resolution.
 
Top Visitor Screen Resolution 2022 2021 2020
1. 1920x1080 25.07% 26.26% 24.34%
2. 1280x720 15.69% 14.86% 12.65%
3. 1536x864 10.65% 10.99% 10.44%
4. 1366x768 8.14% 11.40% 15.14%
5. 1440x900 6.42% 7.45% 8.03%
6. 2560x1440 3.77% 3.65% 3.05%


Top 5 Popular Page

3 out of 5 top pages from 2021 reappear in 2022. A very old blog written in 2013 took the top spot #1 in 2021 and again in 2022 with a record high of more than 35K hits in 2022 alone. Two new blogs written in 2021 appear as #2 and #5.

1. Salesforce: ISBLANK() or ISNULL() ~ 35,399 hits [2013] (#1~2021; #2~2018; #3~2017; #1~2016; #2~2015; #3~2014)
2. Salesforce: Email Template with Hyperlink ~ 24,547 hits [2021] (new blog)
3. Salesforce: EmailMessage object ~ 17,599 hits [2020] (#4~2021)
4. Salesforce: Convert ID from 15 to 18 characters with Excel formula ~ 17,055 hits [2018] (#2~2021; #2~2020; #3~2019)
5. Salesforce: Export Query Result from Developer Console ~ 15,735 hits [2021] (new blog)


I'll skip the detail of traffic from both referral and social as their total traffic contribute less than 2.7%.


Reference:


Page-level ad